Getting Started with Data Visualization
While working on Monte Carlo simulation, I decided to explore one of the most classic and intuitive examples: estimating the value of Pi (π). This experiment helped me understand how randomness, when used correctly, can approximate precise mathematical constants.
Introduction to Pi (π)
Pi is one of the most fascinating constants in mathematics. It represents the ratio of a circle’s circumference to its diameter. Its value is approximately 3.14159, but its digits continue infinitely without repeating. In this work, I used the Monte Carlo simulation algorithm to estimate the value of π using random sampling.
What is Monte Carlo Simulation?
The Monte Carlo method is a statistical technique used to solve problems through random sampling. It is widely applied in finance, engineering, physics, and data science because of its simplicity and effectiveness. The core idea is to use randomness to approximate solutions to problems that are deterministic in nature.
Estimating Pi (π) Using Monte Carlo Simulation
To estimate π, imagine a square with side length 2 units and a circle of radius 1 unit perfectly inscribed inside it. The square has an area of 4, while the circle has an area of πr². By randomly sampling points inside the square and checking how many fall within the circle, we can estimate the value of π.
Geometry Behind the Idea
- Square: Side length = 2, Area = 2² = 4
- Circle: Radius = 1, Area = π × 1² = π
Random Sampling
I generated random points (x, y) such that −1 ≤ x ≤ 1 and −1 ≤ y ≤ 1. These points are uniformly distributed across the square.
Determining Point Position
Each point is checked using the equation x² + y² ≤ 1. If the condition is true, the point lies inside the circle.
Counting and Ratio
Let Ncircle be the number of points inside the circle and Ntotal be the total number of points. The ratio Ncircle / Ntotal approximates π / 4.
Estimating Pi
By multiplying the ratio by 4, we get the estimate: π ≈ 4 × (Ncircle / Ntotal)
Implementation in Python
I used NumPy for fast random number generation and Matplotlib for visualization.
import numpy as np
import matplotlib.pyplot as plt

# Number of random points
num_points = 10000000

# Generate random points
x = np.random.uniform(-1, 1, num_points)
y = np.random.uniform(-1, 1, num_points)

# Points inside the circle
inside_circle = x**2 + y**2 <= 1

# Estimate Pi
pi_estimate = 4 * np.sum(inside_circle) / num_points

print(f"Estimated value of Pi: {pi_estimate}")
With 10,000,000 random points, the estimated value of π came out to be approximately 3.1417408, which is very close to the actual value.
Visualization of the Simulation
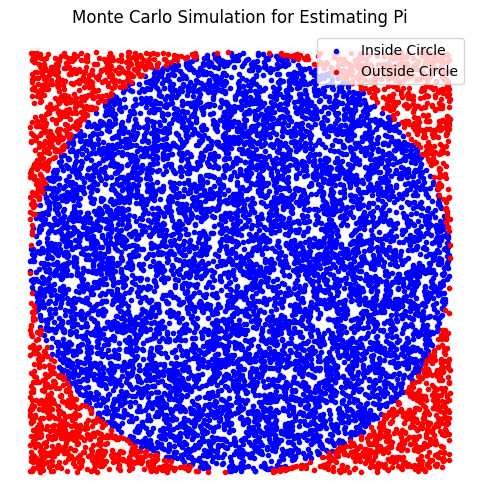
For clear visualization, I randomly sampled 10,000 points from the generated dataset. This makes the inside and outside regions of the circle clearly visible.
import random

sample_size = 10000
indices = np.random.choice(num_points, sample_size, replace=False)

sample_x = x[indices]
sample_y = y[indices]
sample_inside_circle = inside_circle[indices]

plt.figure(figsize=(6, 6))
plt.scatter(sample_x[sample_inside_circle], sample_y[sample_inside_circle],
            color='blue', marker='.', label='Inside Circle')
plt.scatter(sample_x[~sample_inside_circle], sample_y[~sample_inside_circle],
            color='red', marker='.', label='Outside Circle')

plt.gca().set_aspect('equal', adjustable='box')
plt.legend()
plt.title('Monte Carlo Simulation for Estimating Pi')
plt.axis(False)
plt.show()
Visualization Insight
- Blue points represent samples inside the circle.
- Red points represent samples outside the circle.
- The circular boundary becomes more defined as sample size increases.
Accuracy and Convergence
As the number of random points increases, the estimated value of π becomes more accurate. This behavior is explained by the Law of Large Numbers, which ensures convergence toward the true value with sufficient samples.
Conclusion
This Monte Carlo simulation showed me how powerful randomness can be when applied correctly. Even though π is a deterministic constant, random sampling provides an intuitive and visually appealing way to approximate it. This experiment strengthened my understanding of probabilistic methods and their practical applications in data science.